智能文章系统实战-统计数据展示(16)
admin 发布于:2018-7-13 15:58 有 3260 人浏览,获得评论 0 条
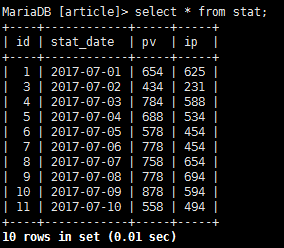
1. 查看统计数据
2. 统计代码(PHP+JS)
<?php
header("Content-Type:text/html;charset=utf-8");
error_reporting(0);

//变量初始化
$title="数据统计";
$labelsArray=array();
$pvArray=array();
$ipArray=array();

//查询统计表数据
$mysqli = new mysqli('localhost', 'root', '', 'article');
if ($mysqli->connect_errno) {
    printf("数据库连接错误!");
    exit();
}

$sql="SELECT * FROM stat ORDER BY id DESC LIMIT 10";
$result = $mysqli->query($sql);
if($result)
{
	while($row = $result->fetch_array(MYSQLI_ASSOC))
	{
	  $labelsArray[]=$row['stat_date'];
	  $pvArray[]=$row['pv'];
	  $ipArray[]=$row['ip'];
	}
}
$mysqli->close();


//合成统计图形需要的数据
$labelsStr="";
$pvStr=0;
$ipStr=0;
if($labelsArray)
{
	$labelsStr="'".implode("','",array_reverse($labelsArray))."'";
}
if($pvArray)
{
	$pvStr=implode(",",array_reverse($pvArray));
}
if($ipArray)
{
	$ipStr=implode(",",array_reverse($ipArray));
}
?>
<!DOCTYPE html>
<html lang="zh-CN">
<head>
    <meta charset="UTF-8">
    <meta http-equiv="content-type" content="text/html; charset=utf-8">
    <meta http-equiv="X-UA-Compatible" content="IE=edge,chrome=1"/>
    <meta name="viewport" content="width=device-width, initial-scale=1.0, minimum-scale=1.0, maximum-scale=1.0, user-scalable=no">
    <script src="https://cdnjs.cloudflare.com/ajax/libs/Chart.js/2.7.2/Chart.bundle.js"></script>
	<title>数据统计</title>
</head>
<body>
<div>
<body>
	<div style="width:70%;" >
		<canvas id="canvas" style="text-align:center;"></canvas>
	</div>
	<br>
	<br>

	<script>

		var config = {
			type: 'line',
			data: {
				labels: [<?=$labelsStr?>],
				datasets: [{
					label: 'PV',
					backgroundColor: "#FF0000",
					borderColor: "#FF0000",
					data: [<?=$pvStr?>],
					fill: false,
				}, {
					label: 'IP',
					fill: false,
					backgroundColor: "#00FF00",
					borderColor: "#00FF00",
					data: [<?=$ipStr?>],
				}]
			},
			options: {
				responsive: true,
				title: {
					display: true,
					text: '数据统计'
				}
			}
		};

		window.onload = function() {
			var ctx = document.getElementById('canvas').getContext('2d');
			new Chart(ctx, config);
		};


	</script>
</body>
</html>
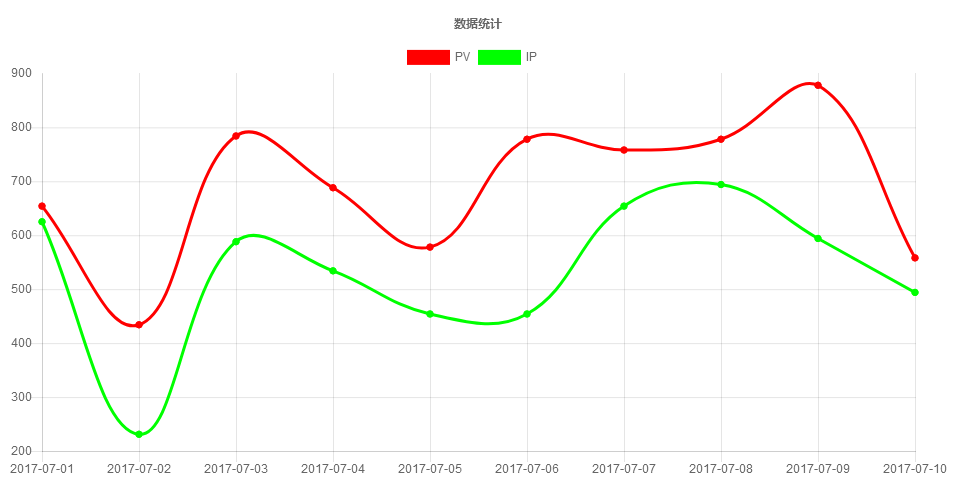
3.查看统计图


